The survey was the core mystery practised by the surveyor. For students of practical subjects everywhere it was always handy to have a vade mecum, a quick reference manual, to which they could refer. By the 19th century there were several authoritative texts available to trainee surveyors and I have chosen two to refer to.
W E Stephenson wrote a treatise specifically on inclosure surveying in 1805 [1]. Stephenson was closely associated with the agricultural improvement movement and would go on to write the Board of Agriculture report on the state of agriculture in Dorset published in 1812. The second book,‘Practical Geodesy’ [2] by J Butler Williams was first published in 1842 by which time surveyor’s had taken on a host of new work including railway surveys. Much of what follows is taken from these two books. Both were digitised by Google.
All surveys served a specific purpose, but whether for inclosure, tithe commutation or estate work the techniques employed were fundamentally the same. Although it is an artificial division it is helpful to think of the survey as comprising two parts. The first we may call ‘data collection and computation’ and the second ‘measuring and mapping’. In reality both parts proceeded together.
‘Data collection and computation’ involved listing individual parcels of land in the parish, then associating other data with each parcel Typically the data collected might include the following.
|
Name of Landowner |
Name of Occupier [tenant] |
Terms of tenure |
Number on map |
Name of premises |
|
State of Cultivation |
Measured Area |
Annual Rental Value of land per acre [shillings] |
Gross Rental Value Area × annual rental |
Tithe rent charge or tithe free |
The way that the data was presented gave rise to different names for the survey, the two commonest names being a particulars survey and a numerical survey.
|
4th May 1821 |
Making Particulars survey of Chilfrome |
|
9th October 1838 |
Do and working on Numerical Survey |
Several survey books made by John Martin, have survived and sometimes he wrote the name on the cover. Usually the were called ‘numerical’ or ‘general’ surveys. No named ‘particulars’ surveys of his have survived but one suspects that the information they contained was similar to the others just arranged differently. It is not entirely clear that the content of the various surveys were ever standardised. It is possible that individual surveyors had their own views on which each type of survey should contain. The books themselves are little more than children’s exercise books.
John Martin’s General Survey Book
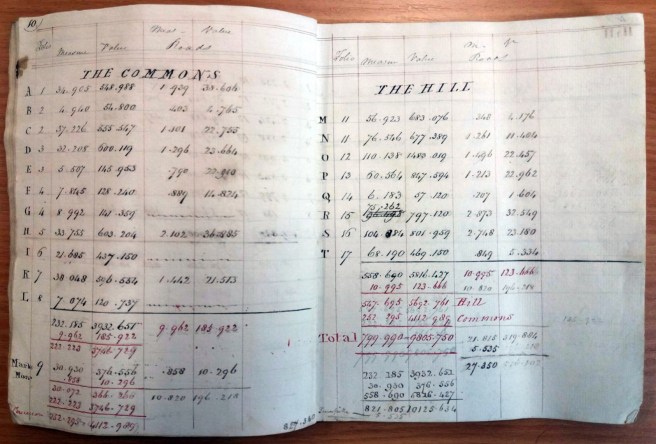
The columns refer on the left to the plot number on the map. Next the area of the plot and its value.Finally the amount that would be lost to new roads – area and value.
An example of a numerical survey is the one he made of the Manor at Rampisham in 1838, a part of which is depicted below.
|
Owner |
Occupier |
Tenure |
No on Map |
Premises |
State |
Quantity |
Price/shillings |
Gross |
|
Maria Beater |
Joseph Davis |
F [reehold] tithe free |
187 |
Allotment on the Hill |
Pa[sture] |
1[a] 3[r] 4[p] |
20s |
[£]1 15 [s] 6 [d] |
Many, if not most surveys, did not require a map to be produced, but a survey without data collection was pretty much valueless. This survey had no map associated with it and nor was one necessary. Except at inclosure the land did not alter greatly between generations of owners and the main purpose of this survey would have been to update tenancy details and land values.
On the other hand when the Rampisham tithe commutation was undertaken two years later the data used for the commutation would almost certainly have been based on this earlier survey and then a map was required. When the manor came up for sale in 1852 and 1861 and in 1870 these particulars surveys were re-made [in 1852 and 1861 by Martin himself] but no new maps were produced.
A full measuring and mapping survey would have been expensive and unless land use had radically altered would be done rarely. Inclosure certainly required a full survey which included measuring but unless there was a really good reason, such as the sub-division of a field with an alteration in the tenancy details, measurement was not generally needed. As will be seen later a survey at Child Okeford dating from 1826, was the basis for a map made in 1834 which was still being used in the early 20th century as the basis for a manorial sale.
The arrival of a surveyor in the parish must of itself have been an event. He was not always welcome and there was considerable distrust. From the first he stood accused by those who had most to lose – the tenants. Nordern, in 1607 did not shy away from addressing the issue; “you looke into the values of mens Lands, whereby the Lords of Manors doe racke their Tennants to a higher rent and rate then ever before….by your meanes rents are raysed, and Lands knowne to the utter most Acre.” [3]
Adding to the distrust was the fact that frequently the surveyor would be a stranger in the parish and would be carrying all of his equipment. This could amount to a not inconsiderable pack.
Measuring by Chain.
The key instrument at the surveyors disposal was invented by an English cleric in 1620 – the Gunter chain which effectively replaced the rod or perch. The chain was four times longer than the perch being 22 yards in length. The pure genius of the chain was that it was divided into 100 links of 7.92 inches. The engineering of such a chain alone was quite an achievement for although the 7 inches might not have caused a problem the 0.92 inches must have taxed the blacksmith, for the nearest approximation of 0.92 inches in fractional measure, is 29/32nds of an inch. The effort was worth it though, as it meant that all measurements could be made in chains and decimals of chains. All intermediate calculations could be done using the decimal system with the difficult conversion to acres roods etc. being made only at the end of the calculation. How this was done is explained in the section on Money and Measures. The chain was marked at every tenth link with a brass mark distinguished by notches and an important accessory were ten “arrows.”
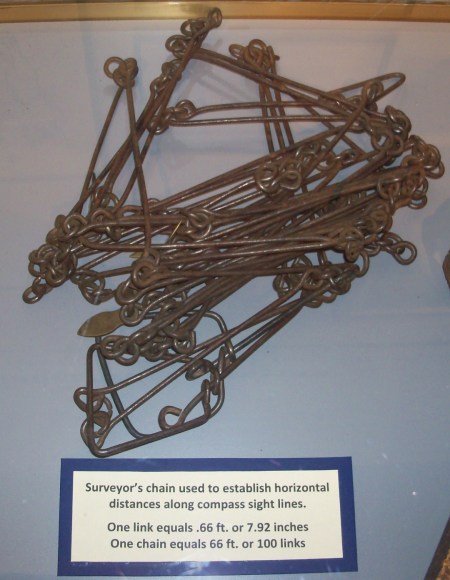
Gunters Chain photographed by Roseohioresident at Campus Martius Museum,Ohio.
Although the Gunter chain is the most famous of all chains, it was not the only one available to the 19th century surveyor. Chains of up to 100 feet in length were available and presumably the only thing limiting the length was the ability to pull it straight. Chains were susceptible to a number of errors. The small circular rings joining the links could distort to become ovals and the links themselves could become bent. Incredibly “the chain also, when used in wet weather, becomes shorter, in consequence of the insertion of dirt between the rings”. So important were potential errors arising using the chain that 1841 the ‘Commission for the restoration of the Standards of Weight and Measure’ recommended that “no person shall be admitted to give evidence in any court of justice having measured land after the passing of the contemplated act [4] with any other than a stamped[standard] measure, or a measure which has been compared, on each day on which any part of the measurement has been made, with a stamped measure.” Butler Williams suggested that the working chain could be tested daily against either two fixed marks made on a horizontal wall or a second standard [stamped] chain which would be used for reference only. Not surprisingly, given the importance of the chains in his work there are several references to Martin buying chains. Typical is this one,
|
9th July 1838 |
Pd Mr Harvey for two new chains -13s |
This seems to have been an average price for him. Were there any alternatives that he might have used? The answer is possibly? Measuring tapes were gradually introduced but the first production version did not appear until 1846 [5] Nevertheless in 1827 he appears to have bought one,
|
27th November 1827 |
Paid for a New Tape 9s 6d |
Measuring by chain was a two person job with the surveyor in attendance. He it was who decided the point from which measurement was to commence and the direction in which it was to proceed. The chain men, or more usually a man and a boy, had a long history, being known as land-meters [6] in medieval times, when they accompanied the Steward on his perambulations. By the 19th century they were more commonly called “Chainmen”.
One of them was called the leader and he had been given 10 metal arrows. The follower fixed the chain at the start point and the leader stretched out the chain and at it’s end he thrust an arrow perpendicularly into the ground. The follower used this arrow as his new starting point and takes up each arrow as he moves forward. When he has gathered all ten he passes them to the leader and as they have ‘changed’ hands, they are referred to as ‘changes’. “In this manner the arrows are changed from one to the other at every 10 chains’ length, till the whole length of the line is measured, care being had to enter every such change in the field-book. At the end of the line, the number of changes, added to the number of arrows in the follower’s hand, and to the number of feet extending from the last arrow put down to the extremity of the line, gives the entire length measured.”[7]
Naturally enough there was considerable risk of error arising in this process, if the chain was not tight or the line of the survey deviated from a straight line for example the apparent length could be less or greater than it truly was. Similarly some chain men had a tendency not to start each measurement precisely from the marked station which could result in considerable inaccuracy. The effect of these “frequent repetition of errors in the coincidence of the extremities of the chain with the arrows” could cause errors which individually would be of little account but cumulatively could be significant. For these reasons he, Butler Williams, had some practical advice: “I would recommend a young surveyor, when employing as chainmen labourers who have been unused to the work to cause them to measure a certain distance, say half a mile or a mile, on a level road, several times, until they shall have learned, …., to obtain very nearly the same result at each measurement.” I wonder if modern surveyors would be happy to obtain “very nearly” the same results?
Accounts of a chain man at work are rare but this example comes from Tithes, Tithe Commutation and Agricultural Improvement, A case study of Dorset c 1700-1850 .PHD thesis Jennifer Gambier, University of Exeter 1990. Presumably the original is in the DHC.
I, James White of the Parish of Charminster, Waterman – I am 74 years of age and remember the Parish of Charminster being enclosed. I was there a day and was employed to drag the chain for Mr John Martin of Evershot land Surveyor and Mr Knight of Puddletown Land Valuer. Where the enclosure was made the base line of Survey was set out from the point of Junction of the River Cerne or Charm running through Charminster with what is called the back stream from the direction of Wrackleford by Cuckoo Pound close by where Mr Jennings...afterwards built hatches. The Base line was drawn from that point of junction to the North East Corner of Stratton Downs where a clump of trees was planted to mark the place. From that Base line the Enclosures were marked and set out. When we came to the Aforesaid Base line from the point of Junction Aforesaid Westward the Boundary line between the Vicar on One side and the land of Lord Ilchester, Mr Devenish and others on the other side was measured to the middle of the stream. Where the water was Shallow I went in with the chain. Where it was deep it was measured with a graduated pole- Eastward from the point of Junction afterwards from Mr Jennings Hatches to the New Lodge-The stream is also the boundary from the New Lodge in the direction of Burton Mile. The hedge between the Waterway is the boundary. Mr Jennings with leave from the Parishioners put in Hatches to irrigate his Mead and with certain stipulations- And I make this solemn declaration conscientiously believing it to be true and by virtue of the statutory declarations
signed
James White October 1835
Ideally it would have been best to use the same people each time but given the large geographical areas that Martin covered in his surveys it would have been unrealistic to expect such men to travel with him [even if under the Settlement Acts they were allowed to do so]. Rarely John Martin names the men he worked with. At the end of October 1810 he was at Farley [and suffering from a very bad cold];
|
27th October 1810 |
Began measuring fine weather Thomas Parsons & a Boy for the chain |
|
29th October 1810 |
out all day measuring T Parsons and Levi Parsons as before |
|
30th October 1810 |
out all day Levi Parsons and his Cousin for chain -cold no better. |
In two entries rather than paying the chain boys themselves he paid their mothers:
|
Accounts April 1810 |
Pd Charlotte Holloways Boy for work £1 5s 0d |
|
Account June 1845 |
Pd Mrs Crofts her son drawing chain at Toller 5s |
The chainmen must surely also have been numerate with some basic knowledge at least of the principles behind the survey. Thomas Parson may also have been fairly well off as, in November 1810,
|
7th November 1810 |
Paid Two Pounds for Lodgings £2 Borrowed the above of Thomas Parsons |
This comes as less of a surprise when one finds that Thomas Parsons and other members of the family were landowners and occupiers in the Parish and potentially beneficiaries under the inclosure– clearly conflicts of interest did not worry them so much then as now.[8] It can only be hoped that Parson’s got his money back but if he did it must have been the following year for there is no mention of it in this diary.
Errors in measurement cannot have been uncommon and in the diaries are two entries concerning this,
|
4th April 1821 |
Went to Chilfrome to find out mistakes in measuring |
|
7th June 1838 |
Went to Toller to find out mistakes |
On neither occasion did he spend longer than a day finding out the ‘mistakes’ which suggests that he already knew where the problems lay. This would have been detected after the initial plotting of his survey, if, for example, one of his right angle triangles had sides of length 3,4 and 6 [9] he would have known immediately that there was a problem in one of the measurements. This would have allowed him to return to the parish and selectively measure the line again.
Chains then were the main instrument used by the surveyor and both books describe surveying by the use of chain alone but it has to be said that it must have been very time consuming to do so when two other instruments were by then widely available. The theodolite was invented in the 16th century and allowed the measurement of both horizontal and vertical angles. Antique theodolites are still a thing of beauty and in a world where there was little machinery of any type, and that which there was tended to be built of timber, the appearance of such a precision instrument as the theodolite must have made quite an impact. Martin’s only direct reference to using a theodolite comes in a series of entries in August 1845;
|
22nd August 1845 |
Making myself acquainted with my new Theodolite but could not make it out to my satisfaction |
|
23rd August 1845 |
Working the theodolite and attending to gardening |
|
26th August 1845 |
Practicing [sic] the Theodolite with Arthur in Funts close |
|
27th August 1845 |
Plotting and proving work done with the New Theodolite |
It is not entirely clear that he was successful in getting the theodolite to work for at the same time,
|
25th August 1845 |
Pd Pullman [the local blacksmith] for Box to send the Telescope to London – 1s |
He did not record if or when it was returned but we may presume it was as he,
|
19th November 1845 |
Paid Mr Cary’s Bill Mathematical Instrument Maker thro “Wilts & Dorset” £4 8s 2d |
The reference to “my new Theodolite” suggests that he had owned one before but even in the 1830’s it is not clear how commonly they were used. Lieut. Dawson drew attention to the fact that not just “practised surveyors” but “all” surveyors should be using theodolites, spirit levels and the like implying that many did not. As late as the second edition of Butler Williams [1855] there is an acknowledgement that surveyors did not always use theodolites ; “the surveyor who does not use an angular instrument….learns by habit to estimate [the angle].The inclination is such cases is estimated solely by eye.”
William Cary was a mathematical instrument maker based in the Strand. He died in 1822 but it is presumed that the business continued on as there is an advert for a millwright wanted in 1834. It is not known how much a theodolite of this type cost but they cannot have been cheap. In 1847 there is a newspaper report of one being loaned by an instrument maker to a fraudster promptly pawned it. Needless to say he was caught and the newspaper noted the value of the theodolite was £15 and that he had pawned it for £10. For a picture of a Cary theodolite from 1840 follow this link https://collection.maas.museum/object/236676
If chains were for length and theodolites for angular measurement the next piece of equipment, the surveyors level, was for height. In some respects similar to the theodolite the level was used to calculate the elevation of one point compared with another; it required an instrument which contained a telescope, spirit level and compass.
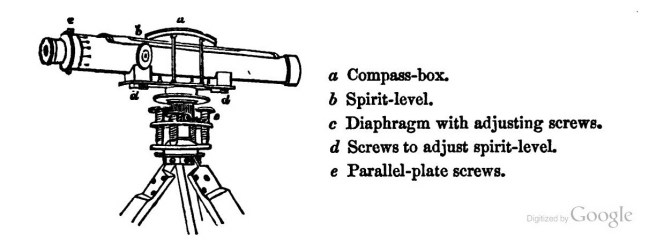
A Surveyors Level from Practical Geodesy , digitised by Google.
The level was set up between two measuring poles at known stations and the difference in readings between the two is the height difference between the stations. In the example below the vertical poles are marked in 1 foot divisions. Starting at station 0, the first pole, and with the instrument perfectly level the surveyor notes the cross hairs are at the 1 foot mark on the first pole.
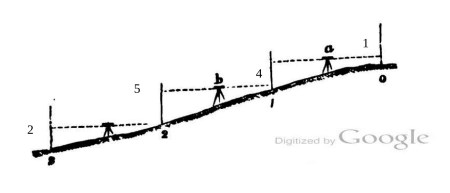
In the other direction the cross hairs are on the 4 foot mark of the pole at station 1. The drop between 0 and 1 is thus three feet [allowing for the fact that the level was 1’ above the ground initially]. Between station 1 and 2 the drop is four and between station 2 and 3 it is two. The total drop therefore between station 0 and 3 is nine feet. The process was limited in that it could only give a difference in height locally. As yet there was no practical way as yet of calculating height above some absolute standard level. Presumably the surveyor chose a position locally from which to start his measurement. Nationally the answer was eventually provided by the Ordnance Survey with it’s primary geodetic levelling beginning in the 1840’s which established a series of benchmarks across the country using a reference point of the mean sea level at Newlyn in Cornwall. There are several references to Martin taking levels, usually in association with roads,
|
8th May 1832 |
Maiden Newton Inclosure Taking Levels of New Line of intended Road |
|
9th May 1832 |
Maiden Newton Inclosure making Section of said Road and Estimating Expenses of making the same |
Unfortunately as with the theodolite it did not always go smoothly,
|
1st April 1845 |
Went to Lower Melbury taking levels of an alteration in the Road for Lord Ilchester But obliged to leave off the Screws of the level now out of order |
|
2nd April 1845 |
At Lower Melbury taking Levels |
|
3rd April 1845 |
Making a Section &c of the above |
Martin does not seem to have had a lot of luck with his instruments, in 1838 he
|
27th August 1838 |
Paid Mr Richards for Toller Mendg Cross Staff &c- 9s |

The cross staff was a metal pole with a square wooden top into which had been cut two lines at right angles to each other. At the base of the grooves were rounded holes which allowed for initial sighting. A certain amount of trial and error must have been necessary using it. Firstly with the cross staff directly on the surveyors base line it was rotated so that the beginning station [A] and the end station [B] were visible along the groove. Then using the other groove he observed his point of interest. This lay directly at right angles to the base line and he then measured from the cross staff to the point of interest along this line. Since the position of the cross staff along line A B was known the position of the object of interest in relation to the base line and its beginning and end points was known.
The cross staff was not much use on rocky surfaces where it could not be knocked into the ground and it was eventually to be replaced by the optical square.

The optical square had a half silvered mirror in it. The observer, once again over the base line AB, looked through an eyepiece towards the next station. As the top half was clear he could see this readily whilst in the bottom half of his vision he saw reflected in the mirror objects at 90 °to his base line.
Conducting the Survey.
“The surveyor, on arriving at the scene of his labour, will ascertain if any map or plan of the parish is extant. For if he have access to such a plan, no matter how imperfect it may be, it will still be of some assistance to him (proportionate to its accuracy), in enabling him to dispose the conduct of his work with greater expedition. He will then procure the assistance of intelligent persons (not fewer than two, if possible, in order that the information given by one may be tested by the other), well acquainted with the boundary, and every object in the parish, to accompany him over it, so as to acquire a knowledge of its magnitude, general form, and bearings, and to ascertain if it contain elevated spots, either natural or artificial, from which commanding views of large portions of the parish may be obtained.”[10]
Whilst inclosure and tithe commutation may have been innovative, the surveyor was dealing with parishes that were enveloped by a range of customary practices that, although they may have been ancient in origin, were often protected by the law. In the search for such customs they could not afford to let any stone remain unturned. Aged parishioners were regularly brought to court to testify to the ancientness of such practices. Hence the need to obtain as much information as possible.
In January 1810 Martin paid two sums of money to a Thomas Short for information about the Parish of Bishopstone [nr Swindon] which was being inclosed,
|
January 1810 |
Paid Thomas Short for information Bishopstone 5s 6d Do 11s 6d |
Needless to say who Short was is not known but he was obviously of some importance as he was also required to attend the Commissioners at Bishopstone, William Jennings Jnr. and George Barnes of Andover.
|
20th April 1810 |
Paid Thomas Short for attendg the Commissioners 5 days 12 6d The Boys do 11s Old Sayer drawing chain 5s Paid Taylor attendg the Commissioner 5 days 12s 6d Short and Taylor all together 10 days see above vis from y 4th of April to the 14th |
|
27th April 1810 |
Paid Labourers finding out property £1 |
The first step was to determine the boundaries of the estate or parish. This was not necessarily an easy matter. In Anglo- Saxon times many estates were defined by charters detailing the boundaries but by the 19th century, even if they were known, they had little relevance. Most boundaries had been determined not by any formal legislation or decree but by customary arrangements, agreed locally. For estate work an ill drawn or overreaching map might provoke irritation between neighbours but when parliamentary inclosure or tithe commutation came along the question of boundaries was brought into the public domain and errors could have legal consequences. When questions had to be decided much was left to the local magistrates and after 1801, the inclosure commissioners, to decide. They were required to make inquiries into the boundaries of the parish and “if not sufficiently ascertained, they shall fix them”. Of course there were checks and balances, descriptions of the boundaries had to be provided to the Churchwardens of neighbouring parishes and any Lords of the Manor and a right of appeal was given to them at the quarter sessions. A similar power was given to the Assistant Tithe commissioners under the Tithe Commutation Act. Here was local democracy at work if ever there was. It appears that in Dorset at least amity ruled as I have not been able to find one example in the quarter sessions books where the boundary decisions were contested.
Sometimes the boundaries of the parish were marked out by some form of marker such as a post, stone, tree or watercourse. A boundary defined like this was defined by its ‘bounds’; if the boundary was actually measured it was defined by ‘metes’. Many parishes of course continued the practice of ‘beating the bounds’ so there were usually plenty of people about who professed some knowledge. The inclusion of young boys in the group was meant to extend the length of the collective memory.
The only example we have of John Martin using old maps comes from 1838 when he had old maps available from Maiden Newton and Charminster but it is not clear if they were used to determine boundaries.
|
4th April 1838 |
Doing various jobs and putting in measures into Maiden Newton Map from Mr Brownes Map [Old Inclosures] |
|
22nd August 1838 |
Charminster Commutation Attending at Charminster to receive Maps of Landowners When Mr James Henning & Mr Sherrin did not produce theirs |
After this preliminary work the next step was to arrange for a ‘Perambulation’ of the parish.
Informal perambulations were virtually mandatory to get some idea of the lie of the land but occasionally they were a part of the formal process of the survey. I have only found them advertised in regard to the inclosure of parishes and, although not exclusively so, the majority of perambulations in Dorset inclosures were carried out by John Baverstock Knight. Since it was such an important part of the process I cannot believe they were not carried out by other commissioners, it’s just that they were rarely advertised.
At Charminster the perambulation was advertised in the Dorset County Chronicle and was carried out on the 7th July 1830. Its purpose was to “ascertain, set out, determine and fix the boundaries of the said Manor of Charminster.” Martin was the surveyor and Knight the commissioner and it it is inconceivable that he did not take part in the perambulations but the only one where he records the fact was an informal perambulation undertaken at Farley [Wilts] in 1810,
|
26th October 1810 |
Arrived at Farley about 12 O’Clock went round the bounds of the Manor |
In August 1810 he made the following entry whilst at Bishopstone. It was a perambulation of sorts seemingly in connection with a new road.
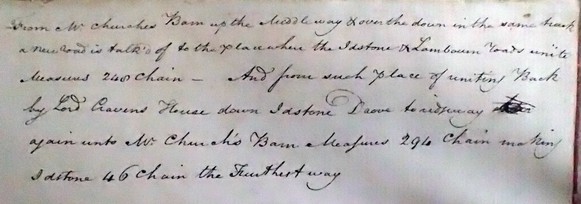
From Mr Churches Barn up the Middleway & over the down in the same track a new road is talked of to the place where the Idstone and Lambourn Roads unite Measures 240 chains – And from such place of uniting Back by Lord Cravens House down Idstone Drove Ridgeway again unto Mr Church’s Barn measures 294 Chain making Idstone 46 chain the Furthest way
Perambulations were essential to settle any possible disputes between parishes, and individual land owners as to where the boundaries lay. The surveyor would have taken the opportunity to stake out points of interest which would be used in the subsequent survey. It would also give him a preliminary idea as to how he could use the lay of the land to best advantage, the aim being, if possible, to use features such as roads, green lanes and footpaths which offered minimal impediment to the use of the chain. “The acquisition of this knowledge, depending on the coud d’oeil, is much assisted by an eye-sketch drawn with rapidity, and showing some of the principal roads, streams churches etc. This hand sketch is not drawn to any scale.”
The surveyor was now in a position to start surveying. Earlier generations had taken a drawing board, known as the plane table, into the field, attached to which was blank paper. It was placed over a fixed point on the ground and bearings were taken of various other fixed points with an instrument called an alidade and then lines measured from the fixed point to each of them. These lines, reduced to scale were then transferred to the paper. The table could be moved and orientated over these points and other points plotted. As there is no evidence that Martin used this technique it will not be discussed further.
The second technique depended on the surveyors skill, experience and artistic flair. He had to envisage the parish or estate in his mind’s eye and divide it up into ‘a system of arbitrary geometrical figures bounded by right lines’ or, to put it more simply – right angled triangles. They were to be “so disposed that they shall pass near all objects included in the survey and serve to determine their position.” After having decided where these triangles should lie they would be used as “bases from which the irregular boundaries and other objects are measured by means of shorter lines at right angles termed offsets.”
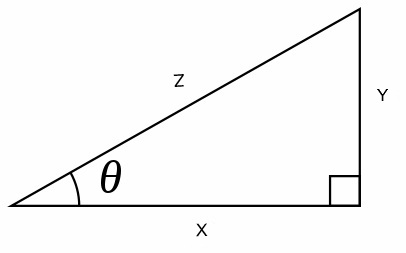
The aim was to construct right angled triangles. From Pythagoras’s theorem X^2 + Y^2 = Z^2. In this case if X = 4 and Y =3 then Z must equal 5. When the sides are whole numbers the triangle is an example of a ‘Pythagorean triple’.
This is a particular example of Pythagoras’s theorem which uses whole numbers but all other right angle triangles obeyed the same rules. If two sides were fixed in length the third had to be fixed as well and could be found by calculation alone. As at least two sides of the triangles were to be ‘constructed’ with the chain these line became known, not surprisingly, as ‘construction’ lines.
A part of the surveyors skill was in deciding where these construction lines were to run from and to. In general they ran near the presumed boundaries of the property and the process was known as ‘making the lines’ [11] and there are occasional examples from the diaries of him doing this,
|
5th February 1838 |
Went to Stratton with Edwin making Lines on Langford Farm Slept at Stratton |
|
15th October 1845 |
Exeter Yeovil and Dorchester Railway Went to Beaminster on Railroad works slept at Do Viewing the Lines all day |
|
16th October 1845 |
Taking Perpendiculars slept at Netherbury |
|
17th October 1845 |
Do and laying out Lines slept at Melpash |
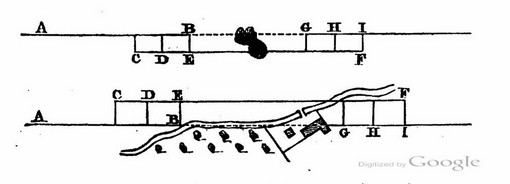
Where the shape of the parish was already known and in the comfort of a warm office, making the lines seems an easy thing to do. On the ground and without the benefits of aerial photography the practical difficulties must have been immense. The lines might be several miles long, run over undulating ground, or across a river, through hedgerows and so on. It not only took considerable imagination to construct the best lines from ground level but also great practical skill for all of these lines had to be reduced to the plane [see below]. A few of Martin’s maps show the use of these construction lines and there is one account of him establishing a base line [see entry on Charminster inclosure].The principle of these lines is demonstrated in the map below taken from Lieut. W K Dawson’s instructions to surveyors embarking on tithe commutations. The map below is of the imaginary parish of Eye.
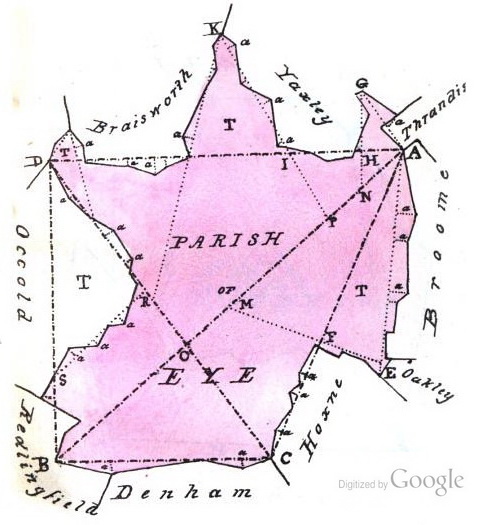
Taken from “Tithe Commutation. Tables showing at one view the value, in Corn-rent of the rent-charge payable in Lieu of tithe” by W Palgrave Simpson. 1837 Digitised by Google.
Dawson has three primary triangles, ABD, ABC and ADC. Small lines such as MF and CO are drawn in as ‘tie- lines’ which act as a means of double checking the measuring. Offsets are shown [marked ‘a’] for example on the line AE and these in turn create a whole series of other triangles or oblongs whose area can be calculated or approximated. Sounds easy doesn’t it. But between point A and Point B there could be several large hills, or woods, or lakes. And the parish is full of hedgerows which, even on horse back can barely be seen over, and where the heights of objects are not known by anyone with certainty. Then imagine surveying in the wet where the entries in the field book have to be written in ink, and taking the book back to begin plotting by natural light in the day or candles at night. Better hope your eyesight is good and you don’t get cataracts. If you are in any doubt as to the practical difficulties they faced go to any of the parishes mentioned here and imagine undertaking the tasks that Martin had to do.
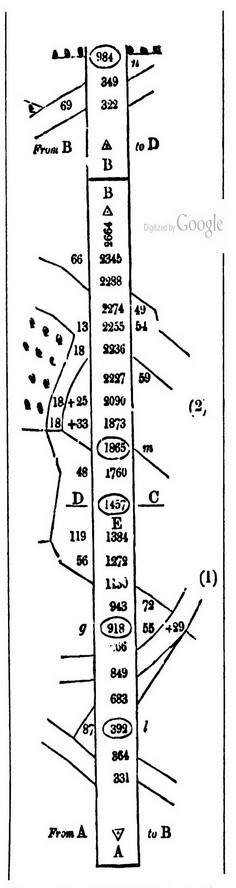
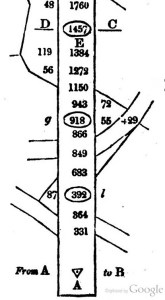
Having determined where the lines should be, the next task was called ‘running the lines’. The survey book, which in this case is not linked to the above map, was divided into three columns. The starting point, in this case the dot within the triangle labelled A, was always at the bottom of the line and the page. On either side of the central column is written From A on the left and to B on the right, thus giving the direction of travel. When point B was eventually reached a line was drawn across the central column. The surveyor fixed his first arrow at point A and set off along the line. The numbers within the column represent the number of links from the starting point. [12] At point B it will be seen that this is 2664 links which represents a distance of 26 chains and sixty four links. Where the line AB intersects with another base line, or a connecting line inserted to create as secondary triangle, the number is circled.
The crossing point of each road, field, stream, river or ‘stations’ as they were known were marked off where they crossed the line. At this stage the readings do not have to be to scale and this can be seen easily. The line DC is crossed at 1457 links and just above that is the number 1760 a difference of just on 300 links yet the distance between these two numbers is about the same as between 1760 and 1865 yet it has a difference of just 100.
Numbers outside the column are the off sets to various points of interest. Just below line DC on the left is the number 119 and just above a number of 48. These represent off sets to a boundary hedge but again they are not to scale.
Note the “staggered” appearance around the central column. It was important that roads or other features “leaving” the column were at the same level as those “entering” it. Note how even the width of the road can be determined in this way. The road just above A is 23 links wide.
Much is made in the books of the fact that the surveys were conducted by chain only and considerable ingenuity was demonstrated in dealing with difficult situations.
The line A I is obstructed by trees in the upper example and by a river and buildings in the lower. Three offsets C D an E are made [to ensure they are parallel to AI and the line is then continued along from C to F. Three more offsets are then used to ‘rejoin’ the main line AI. Even triangles could be constructed from measured lengths.
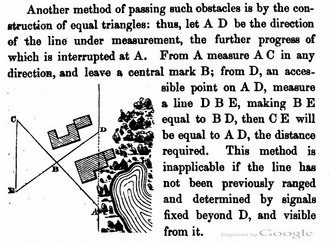
Technique used when a building obstructs the view. No theodolites were involved, it was all done using the chain.
The impression is given that all surveying can be done by chain alone but to have done so must have been inconvenient and can hardly have been the case. The larger part of Butler William’s book is in fact concerned with surveying using angle measuring instruments such as the theodolite, but in so far as estate surveying we need go no further. All that remains to do is to start applying the results of the survey to vellum or paper.
Data Manipulation.
So far the survey can be regarded as both a visual aide memoir and numerical record.
Before laying pen or pencil to vellum or paper the surveyor had to settle in his mind how he would present the results of his survey. The first thing to decide was what the scale of the map was to be. As the survey itself was not scaled it could be adapted to any scale he chose. It was not uncommon for maps to be prepared at different scales and then enlarged or reduced later. The first series OS maps for example were drawn initially to a scale of 6 inches to the mile and the maps were reduced to 1 inch to the mile before publication by the copper engravers. [13].
For estate maps there were two common scales and as with all map scales it is easy to get them wrong particularly when the same scale can be written in two ways.
|
Scale |
Large or Small |
1 inch of map represents this amount of real distance. |
|
3 chains to the inch |
Large |
66 yards |
|
6 chains to the inch |
Large but smaller than 3 chains |
132 yards |
|
Scale |
Large or Small |
This number of inches on the map represents 1 mile of real ground. |
|
3 chains to the inch |
Large |
26 ¾ |
|
6 chains to the inch |
Large but smaller than 3 chains |
13 3/8 |
These scales are much bigger than anything the Ordnance Survey produced for general release. Their largest scale was 6 inches to the mile or roughly 12 chains to the inch. In general the largest scale of map possible was the one that was to be preferred. When the map maker has 26 inches of map to represent a mile of real land he can draw much more detail on it. Moreover, as we will see later, at 3 chains to the inch it was possible to take accurate measurements directly from the map where as at 6 chains it was not.
The next issue “demands especial mention because some inattention to it is not very unusual” [14]. This was the necessity of reducing the measured length of the survey to the horizontal plane. The reason being that “without this reduction of the lines they cannot be laid down in plan upon a flat surface and distortion of the outline must inevitably result.” There was it appears considerable resistance to this idea amongst farmers. Both Stephenson in 1805 and Williams in 1855 still mention the issue and the fact that it is being discussed in books fifty years apart indicate that it was still a hot issue.
From the cartographer’s point of view the matter was one of trigonometry;
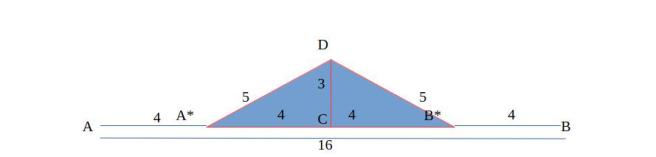
Two surveyors are walking from A to B. The first walks along a flat surface and measures the distance as 16 units. The second has to take the route over the hill and he measures the distance as 18 units.

Both these circles are of the same diameter. If we were able to bisect the earth and follow of the two men we can see that the distance on the circle that they each travel paths is the same despite the second having had to go up the hill. Similarly looking from space the height of the hill does not affect the area covered by its base on the surface.
If both surveyors were to plot their results as ‘is’ they would of course plot two different lengths so the question was how to deal with hills [and incidentally dips] when the plot was made. The answer was known as reducing to the plane. The problem was both practical and conceptual. The practical problem was simple enough how can you measure the true distance AB if there is a large hill on top of it?
In the example shown above the angles DA*C and DB*C can be found for there is a flat plane each side of the hill. Knowing these angles, the lengths of A*D and DB*, the height of the hill and the length of its base A*CB* can be calculated from trigonometry.

If z is known then the length x = z cosine Ѳ [phi]
This resolves the problem and is easy enough in a classroom but somewhat harder in the real world. For a start and it is a question that is never answered in any of the texts – which plane ? Ideally it would be taken to sea level, although this begs the question which sea level ? High water, low water or somewhere in between ?
If the cartographers were concerned to reduce the plot to the plane the farmers had another perspective. Their concern was not about the cartographic accuracy of the map, but the fact that it would impact on their rents. Surely, they argued, a curved surface such as a hill had a greater surface area than a flat surface and so you could grow more on it. And if that was the case then surely that should be acknowledged in some way on the map. At first sight they had a point,
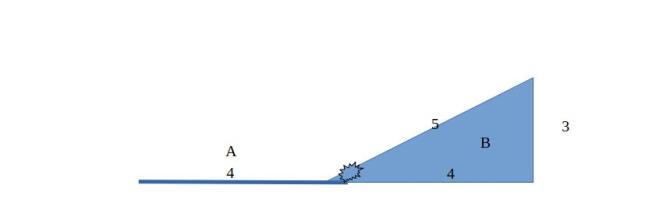
When reduced to the plane, Field B has the same base length as Field A. But the man who farms Field B has a longer slope to grow his crops on and hence a greater area. If Field B is reduced to the plane the rent of that field will be the same as that of Field A, yet the farmer who owns field B grows more crops on it. Surely, the argument went, the productive area of field B being greater than that of field A, wasn’t it only reasonable that some account should be taken of this? The problem was not inconsiderable as the rent was based on both the quality and area of the land.
It is clear that considerable debate was generated by this, Stephenson in 1805 argued that “The question, whether the hill will produce more than a piece of level ground the quantity of its base…. appears not difficult to solve: it is evident the hill will produce the greatest quantity of pasture”. He stressed the importance of reducing to the plane in order to make the map but he accepted that a hill laid down to pasture would be more productive. He did make the point that this only applied if the hill was pasture [grass]: “there can be little difference in trees, &c.”
Forty two years later Butler Williams had clearly faced the exact same arguments from the farmers and came to the same conclusion “…since plants shoot up vertically, the vegetable produce [with the exception of grasses] on a rounded eminence does not in general exceed in quantity what would have been grown upon its base”.
 Doubtless many farmers [in Dorset at least] would have pointed out that they only grew grass on the hills and even fewer would have been satisfied that a rounded eminence does not, “in general” produce more than a flat base. Does it or doesn’t it we can hear them cry. In the end the map makers won of course and the farmers accepted the situation. It meant of course that before plotting could actually begin all the measurements that had been taken had to be reduced.
So long as the surveyor had a theodolite it was not too difficult to reduce the survey to the plane but in the event that a theodolite was not available there were two possible solutions to the problem. Butler Williams, admitted that “the surveyor who does not use an angular instrument….learns by habit to estimate [the angle].The inclination is such cases is estimated solely by eye.” Hardly a recipe for accuracy but there was another little trick he had up his sleeve which made life easier. He published a table which, so long as the angle of the slope was known, allowed measurements to be made that were already reduced to the horizontal. This involved ‘dropping’ links from the chain. For example at 8° [degrees] inclination for example one link was “dropped” from every 100. Instead of fixing the arrows at every 100 links they were fixed at 99. When it came to plotting the survey the number of changes made and thus the number of chains could be plotted without further adjustment although how they coped now with parts of a chain is not known. A considerable time saving if not exactly accurate.
The Genealogist publishes all the tithe maps and now can be overlayed on the modern OS maps ; there is a remarkable concordance in most tithe maps. A credit to the skill of the 19th century surveyor.

Land surveyor father to son: “One day my boy all this will be yours to reduce to the plane.” Looking towards Buckland Newton from Revels Hill.
The final thing to be settled was how the map was to be orientated on the paper or vellum. Small scale maps were plotted with the north upwards. Large scale maps of parishes etc. were more problematic as a large amount of the earth had to be drawn on a relatively small area of paper. In so far as Martin’s tithe maps were concerned there is no consistency in orientation and one suspects that for pragmatic reasons the maps were orientated in such a way simply to make optimal use of the space on the paper.
At any point on the earths surface, and at any time in history there is an angular difference between the magnetic North pole [which is measured by a compass] and the True North pole – the direction along a meridian towards the geographic North Pole. This difference is known as magnetic variation [or declination] and changes over time and position on the earth. Theodolites and levels were equipped with compasses which pointed to the magnetic pole. When surveying within a parish this did not matter, as what was normally required was the angular difference between two lines rather than their absolute bearing. However when it came to the orientation of the map it was important to align the map with the meridian line – the line of longitude. Butler Williams demonstrates how this could be found using a theodolite [its complicated], the pole star which is within about 1 °of true north and a method involving a stick.
A stick was planted in the ground and, say three hours, before noon another one was planted at the end of the shadow. An arc was then described using this distance as the radius. In the afternoon, three hours after noon another stake was planted in the west. By using sticks of different lengths and times you get a series of arcs. True North lies at the midpoint of each arc.
However he did it [and he does not say] there is evidence that Martin’s maps were orientated to true north. There are occasions with Martin’s maps when some readily identifiable feature can be used to determine the accuracy of the orientation of the map. Such is the case at Child Okeford. Unfortunately it is not possible to reproduce these copyrighted images but the arrow of the cartouche is not aligned with the sides of the map as it would be on a modern map where the sides of the map are parallel to the meridians. There is however a road, the lower common road, which runs due North in real life. On the tithe map it runs parallel to the cartouche and when the tithe map is rotated so the road points true north so does the cartouche.
Next Making the Map
Previous The Surveyor
1 Stephenson W. E. The System of Land Surveying at present adopted by surveyors and commissioners.
2 Butler Williams J Practical Geodesy London 1842 2nd ed 1855 Digitized by Google
3 John Norden The Surveyors Dialogue 1607
4 It would be another 14 years before it would be passed.
5 The Scientific Instruments of the Lewis and Clark Expedition Silvio Bedina 1984 University Nebraska
6 Surveyors and Statesmen, by Sarah S. Hughes
7 Butler Williams ibid.
8 Extracts from Wiltshire Tithe Apportionment 1975 ed R E Sandell
9 In case you have forgotten it should have been 3,4,5 as per Pythagoras’s theorem.
10 Butler Williams ibid.
11This is sometimes called traverse surveying.
12 Other methods were to record the change of arrows rather than the number of links.
13 Hewitt R Map of a Nation The History of the Ordnance Survey.
14 Report from Lieutenant Dawson R E to the Tithe Commissioners for England and Wales 1836
